Hello,
We've got a Trimble S6 robot. I've always entered the temperature and pressure on instruments manually instead of allowing the instrument to sense it. I've noticed significant differences on various instruments I've used between the current forecast and what the instrument reports.
Your thoughts on this would be appreciated, Thanks, Paul
Just my 2-bits...but NEVER enter a "forecast" set of Temperature and Barometric Pressures into a Total Station (or EDMI) if you want accurate readings.
A GOOD Thermometer costs maybe 10-20 bucks, and e Good Barometer around 200 bucks (old school stuff).Chances are pretty (REAL) good that the sensors in the Instrument are giving you GOOD values, my OLD gear doesn't have those bells and whistles.
Loyal
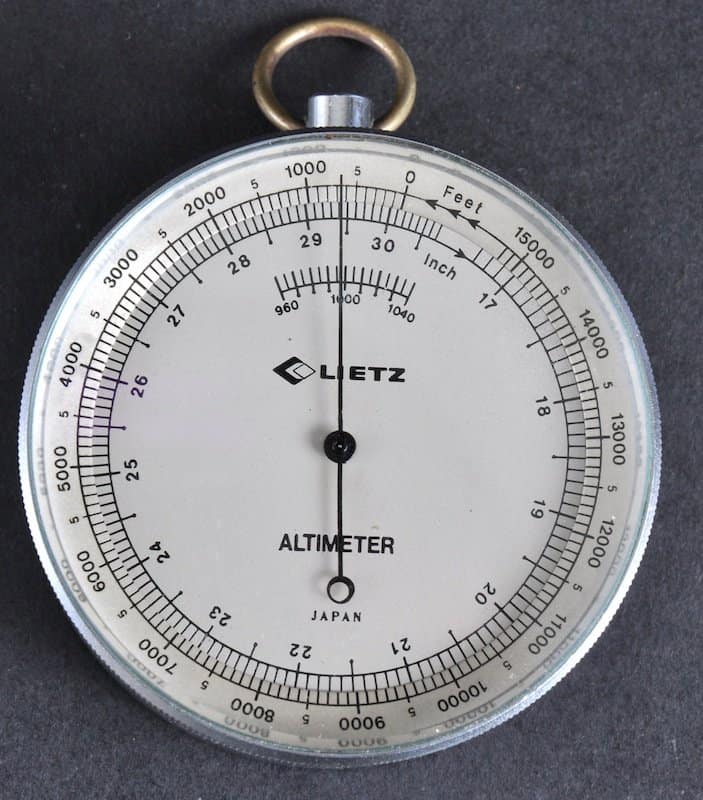
I use a GOOD thermometer and altimeter, which is a barometer that has a scale used to get the adjusted atmospheric pressure for the elevation of my instrument. I am curious as to how the automated features in your instrument adjust for the atmospheric pressure at a given elevation.
I use the weather station to calibrate the barometer function of my altimeter and then read the adjusted atmospheric pressure under the elevation of my project on the altimeter scale.
not my real name, post: 398328, member: 8199 wrote:

I use a GOOD thermometer and altimeter, which is a barometer that has a scale used to get the adjusted atmospheric pressure for the elevation of my instrument. I am curious as to how the automated features in your instrument adjust for the atmospheric pressure at a given elevation.
I use the weather station to calibrate the barometer function of my altimeter and then read the adjusted atmospheric pressure under the elevation of my project on the altimeter scale.
I have one Just like that (it's the first one I ever bought)!
I also have 2 Thommens (pricey), and a Brand X that I gave $75 bucks for (which I don't recommend).
Loyal
It is surprising that so many pieces of equipment purport to measure temperature/pressure but do so incorrectly.
In days past it was always a struggle to get helpers to remember the thermometers must be shaded, and that altimeter and barometer readings are not interchangeable. Attention to detail was grilled into me early in my career. I thought it made me a better surveyor.
Given that you note significant differences, why wouldn't you use measured values.
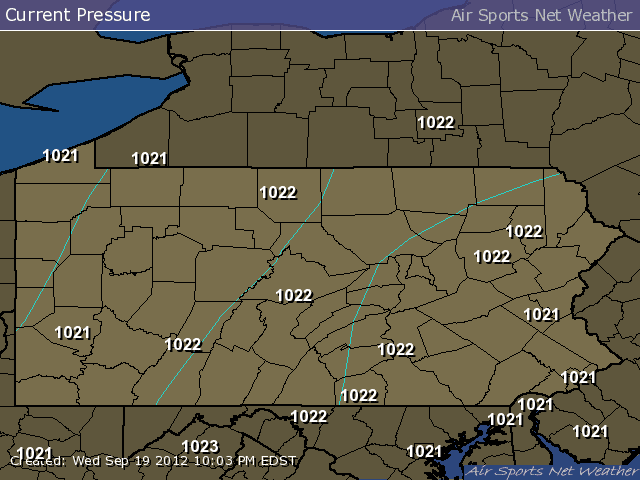
The S6 (at least the one I have) has a barometer only. When I used a Zeiss S10, it had both temperature and pressure sensors. Note that these instruments measure the station pressure (i.e. the actual pressure), which is what you want. DO NOT use sea level pressure directly (unless of course you are at sea level). SLP is what is disseminated in typical weather observations and what they give on TV, etc. It is a simple matter to convert a SLP to a station pressure. In fact, that is a very valid way to get station pressure, since pressure does not vary much spatially unless there is a front moving through. For example, here is a plot of sea level pressure across the state of Pennsylvania on 9/19/12 (in millibars). It takes a change of about 3 mb to make a 1 ppm difference in the distance.
If this was a plot of station pressure, it would look like a topo map, varying more by elevation than spatially. A change in elevation of 100 m (328 feet) changes the pressure by about 11.8 mb, or about 4 ppm in the distance.
Temperature, on the other hand, does change a lot spatially and somewhat with elevation. There is a formula for lapse rate (rate of change with elevation), but it is more subject to error than the almost exact formula for pressure. Places are sunny, cloudy, there is uneven heating depending on what the surface is, and the ground radiates heat, etc.
I have found the barometer on board the S6 is quite accurate. HOWEVER, it should be noted that if you have a large difference in elevation, then the pressure at one end only may not reflect the AVERAGE along the line.
In the past (before GPS), geodetic surveyors when measuring long lines have sometimes used an airplane or helicopter flying along the line to try and get the most accurate values possible for use in reducing the data. I would think a drone could be used for that nowadays if it was critical.
John Hamilton, post: 398339, member: 640 wrote: I have found the barometer on board the S6 is quite accurate. HOWEVER, it should be noted that if you have a large difference in elevation, then the pressure at one end only may not reflect the AVERAGE along the line.
I assume that someone has evaluated different algorithms for estimating the line average refractive index from temperature and barometric pressure measured at the endpoints of the line.
If you are getting the "forecast" pressure from the internet you have been using barometric pressure - that is, corrected to sea level. You want the actual "station" pressure, measured at the instrument. The lowest points in Oklahoma are at about 1000' asl, going up to over 4000' asl in the panhandle. Arizona has a similar variation in elevation. That's enough to make a big difference.
Do not enter the pressure!!! use the instrument pressure, I thought my S6 was crazy wrong looking at the forecast. mentioned to the dealer he said the weather is adjust to sea level for aviation and is not the true pressure at your altitude. I work from 3000 to 6000ft so I was seeing huge numbers and screwing myself. let the S6 run its barometer and you key in the temperature.
Kent McMillan, post: 398344, member: 3 wrote: I assume that someone has evaluated different algorithms for estimating the line average refractive index from temperature and barometric pressure measured at the endpoints of the line.
My standard procedure was to actually MEASURE the temperature & Barometric Pressure at BOTH ends of the "line" at the time of the observation (measurement). That's why I have more than one set of Thermometers and Barometers.
Geeoddmike can probably link us to some info on the Long Range measurements in California using the Red/Blue LASER and flying a fixed wing & helicopter back and forth measuring Temp/Pressure between the end points (as I remember reading many moons ago).
Loyal
Loyal, post: 398352, member: 228 wrote: My standard procedure was to actually MEASURE the temperature & Barometric Pressure at BOTH ends of the "line" at the time of the observation (measurement). That's why I have more than one set of Thermometers and Barometers.
Geeoddmike can probably link us to some info on the Long Range measurements in California using the Red/Blue LASER and flying a fixed wing & helicopter back and forth measuring Temp/Pressure between the end points (as I remember reading many moons ago).
I recall the discussion of multicolor laser EDMs that I think were used in surveying at least some lines in the radial line scheme around the McDonald Observatory in West Texas around 1976 (I haven't cheated and looked at the technical paper to refresh my recollection), with the scale of others determined by the ratio method of comparing the scale of pairs of lines measured nearly concurrently. It would be interesting to know how well the most sophisticated EDM measurements made in the 70s have held up to modern resurveys with GPS.
Kent McMillan, post: 398354, member: 3 wrote: I recall the discussion of multicolor laser EDMs that I think were used in surveying at least some lines in the radial line scheme around the McDonald Observatory in West Texas around 1976 (I haven't cheated and looked at the technical paper to refresh my recollection), with the scale of others determined by the ratio method of comparing the scale of pairs of lines measured nearly concurrently. It would be interesting to know how well the most sophisticated EDM measurements made in the 70s have held up to modern resurveys with GPS.
I agree Kent, it would be quite interesting (to me anyway). Due to Plate Tectonics, I suspect that the California Data would be somewhat problematical at best. I suppose that a few (maybe very few) of the "lines" may be reasonably stable, but I wouldn't bet much on it.
Loyal
Pressure decreases about 1"hg per thousand feet of altitude. The decrease is not linear though if you want to be precise.
I bought a Casio Protek watch with the triple sensor. Was looking at a eesther station to keep in the box but the watch made more sense. I cant forget it somewhere,its always on me and doubles as a watch,GPS tracks my movement so me thinks it works well.
Also have a S6 with the built in barometer. It agrees well with what the Casio reads out. Usually within 5mmHg of each other
I would trust the internal on the robot
Sent from my SM-N920C using Tapatalk
John Hamilton, post: 398339, member: 640 wrote: The S6 (at least the one I have) has a barometer only.
I think the thermometer is deliberately missing as it would give an unrepresentative reading straight out of the van/box, in the sun etc; It would not read the correct air temperature under typical conditions. Maybe in the controller might be more practical. At least you could put it in the shade.
FYI, the US NGS has a group performing site surveys for sites in the IGS network. They did a co-location survey at the McDonald Observatory. Their procedures, results, equipment, etc are detailed here: http://www.ngs.noaa.gov/corbin/iss/reports/FortDavisSiteSurvey.pdf
They did not attempt a resurvey of the 1976 project. No detailed discussion of the modeling of atmospheric effects on their EDMI measurements.
I do not believe the earlier survey used a two-color laser. Will need to reread the technical. report. Oops. Reread the report and my recollection was wrong. See:
The internal pressure sensor in the S6 is plenty accurate, but I also have a Kestrel 5500 that works very well.
Here is a pdf of a powerpoint presentation I gave at Trimble Dimensions 2012, with many of the formulas needed for proper reductions.
My earlier posting should have used the Technical Report linked below. The link in my message above is to a subsequent survey interesting in its own right.
http://www.ngs.noaa.gov/PUBS_LIB/SurveyOfTheMcDonaldRadialLindSchemeByRelativeLaterationTechniques_TR_NOS74_NGS9.pdf . A 1977 survey and 1978 TR.
The site is a "little" out of the way but well worth a visit. They have a nice tour of their telescopes. Wonderful dark skies. I stay at the Paisano in Maria when visiting.
The above photo looks like station BALDY 1917 on Mt. Livermore. Here's one more link to an NGS Technical Report upon an even earlier survey at the McDonald Observatory using modified Model 8 Geodimeters to measure ranges and adjusting the ranges by the so-called "ratio method" to give them a common scale.
Edit: I see that I'm late to the party with the above link.


