In some recent work in North Texas, it was not particularly difficult to find a good site to leave my vintage 4000ssi running for eight hours while I was off doing other things. When the surveyors arrived in 1857, The land was prairie with a few scattered mesquites and hackberries. Along the rivers there were other trees, or so one would conclude from the bearing tree calls given by the 1857 surveyor.
Now, the landscape is mainly in farm and pasture land, with enough of the former to keep the crop dusters busy wrecking airplanes to make piles of colorful crumbled wing and fuselage sections near a hangar I drove past every day.
In the late 1930s long rows of trees of hardy native species were planted along the edges of fields to form shelterbelts and capture wind-borne soil that moved in great clouds in the drought years. Those shelterbelts are now long, linear dunes chest or head high thick with the descendants of the original plantings, mostly forests of Western Soapberries.
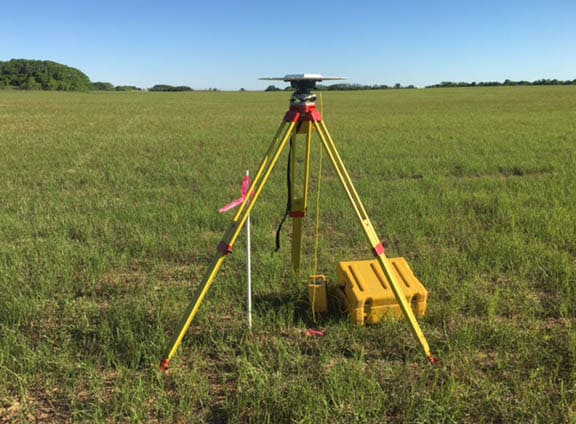
You can see one of the shelterbelts in the distance in this photo behind CP 1 where I set up the vintage Trimble L1/L2 Micro-centered Compact Geodetic Antenna with Ground Plane hooked up to the 4000ssi.
When it came time to submit the observations to OPUS, I was careful to note that OPUS had selected three CORS sites that were in Texas, those connected by the blue vectors drawn on the CORS map below.
Just as a point of curiosity, since I had slightly more than 8 hrs. of observations, I submitted the data again, but excluded the stations used in the first solution. OPUS selected the stations connected by the dark magenta vectors drawn on the CORS map, one of which, somewhat alarmingly, was in Oklahoma. However, that CORS site, WMOK, is one operated by UNAVCO and so is much less suspect than others might be.
The two different solutions were nearly identical,
[PRE] N (ft) E (ft) Elev. (ft.)
1Day124a _____10.627 _____69.108 1331.593
1Day124b _____10.599 _____69.114 1331.593
[/PRE]
so I used both, weighted by the variance-covariance matrix that OPUS reported (scaled by a factor of 2.5 which experience indicates is realistic) to generate a least squares estimate of the position of CP1. It made a slight improvement in the uncertainty of CP1, reducing the standard errors of the N and E components to under 0.01 ft. which considering that the average distance to the six CORS antennas was about 86km, with the shortest about 42km and the longest about 102km, never ceases to amaze me.
Actually, Kent the solutions are even tighter than the two OPUS solutions indicate. If you look at the short term time series for the 6 CORS stations you will see a slight bias in the northing for these 4 CORS stations: TXCU, TXOL, TXTH and WMOK.
Unsurprisingly, WMOK has the largest bias. 😉
I wouldn't trust any vector which crosses the Red River Gradient Boundary. God knows what havoc the ghost of Arthur Stiles might do to it.
Gene Kooper, post: 427236, member: 9850 wrote: Actually, Kent the solutions are even tighter than the two OPUS solutions indicate.
Yes, I apologize for mentioning it, but when you apply the corrections from the short-term time series, the two different solutions agree within about a millimeter in N and E components:
[PRE]1Day124a
dN dE dU
TXCH 0.28 -0.18 +1.00cm
TXQU -0.43 +1.25 -1.08cm
TXWF 0.06 -0.32 0.28cm
---------------------------
Mean 0.03 0.25 0.06cm
1Day124b
dN dE dU
TXTH 0.83 -0.09 -0.98cm
WMOK 1.16 0.05 -0.07cm
TXOL 0.87 -0.10 -0.52cm
--------------------------
Mean 0.95 -0.05 -0.52cm
N (ft) E (ft) Elev. (ft.)
1Day124a _____10.627 _____69.108 1331.593
+0.000 +0.008 +0.002
-----------------------------------
_____10.627 _____69.116 1331.595
1Day124b _____10.599 _____69.114 1331.593
+0.031 -0.002 -0.017
-----------------------------------
_____10.630 _____69.112 1331.576[/PRE]
Dave Karoly, post: 427237, member: 94 wrote: I wouldn't trust any vector which crosses the Red River Gradient Boundary. God knows what havoc the ghost of Arthur Stiles might do to it.
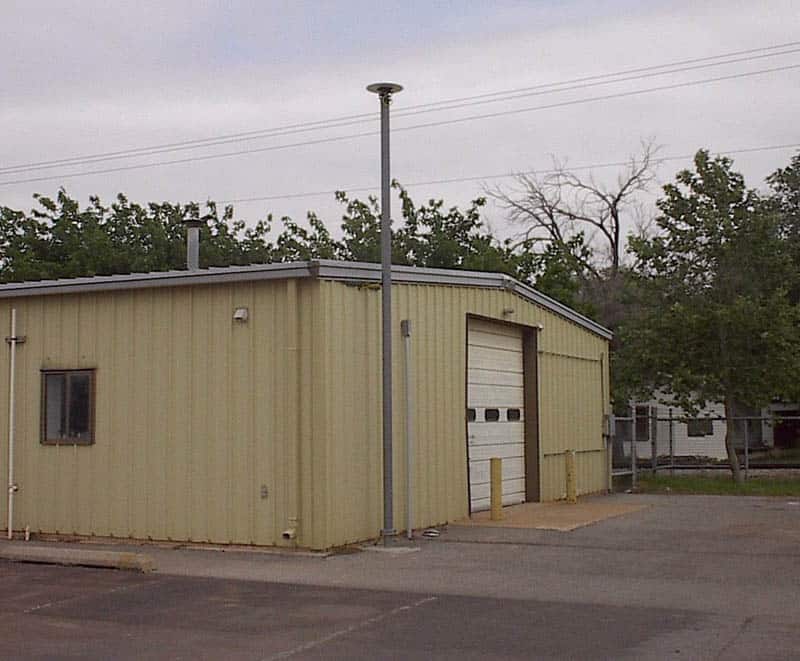
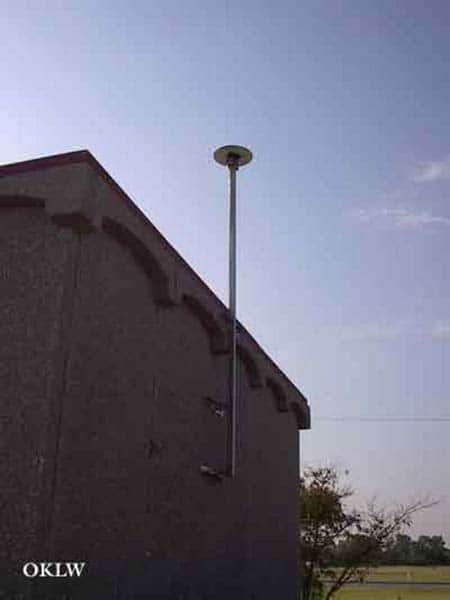
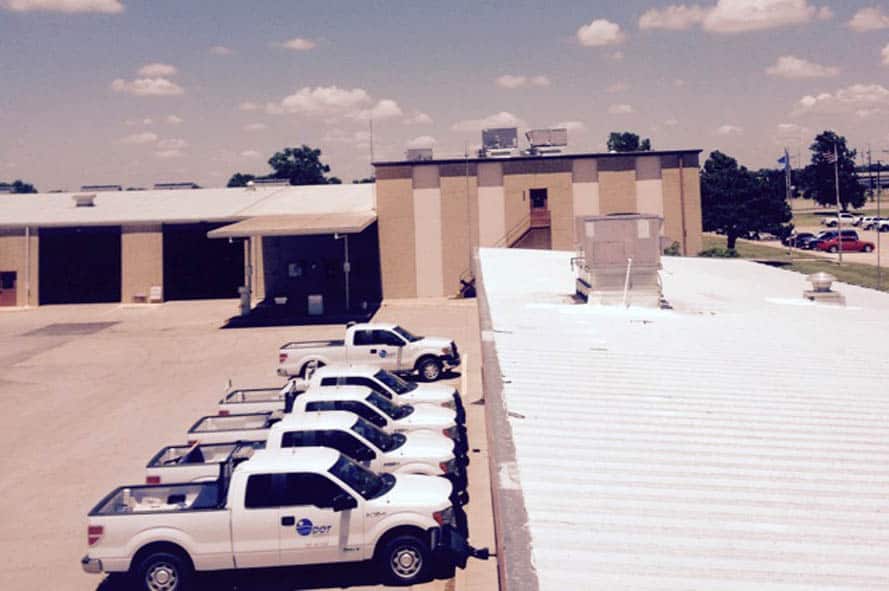
Actually, if you look at the photos of the Okie CORS sites, you don't need Arthur Stiles to tell you that other options might work better. Here, for example are photos of the Okie CORS antennas nearest to my project in North Texas:
OKAL
OKLW
OKDN
Note that they didn't even submit a photo of the actual antenna mounting for OKDN (presumably because it looks so iffy), but it appears that it is just a piece of conduit bolted to a metal shed.
On the other hand here is what WMOK (the CORS site that I did use) looks like, a typical UNAVCO mounting in a rock outcrop:
Kent McMillan, post: 427242, member: 3 wrote:
On the other hand here is what WMOK (the CORS site that I did use) looks like, a typical UNAVCO mounting in a rock outcrop:
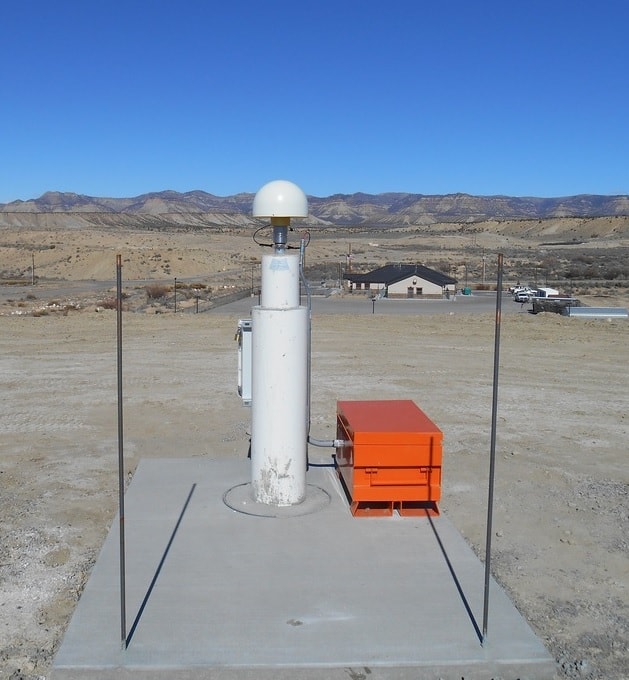
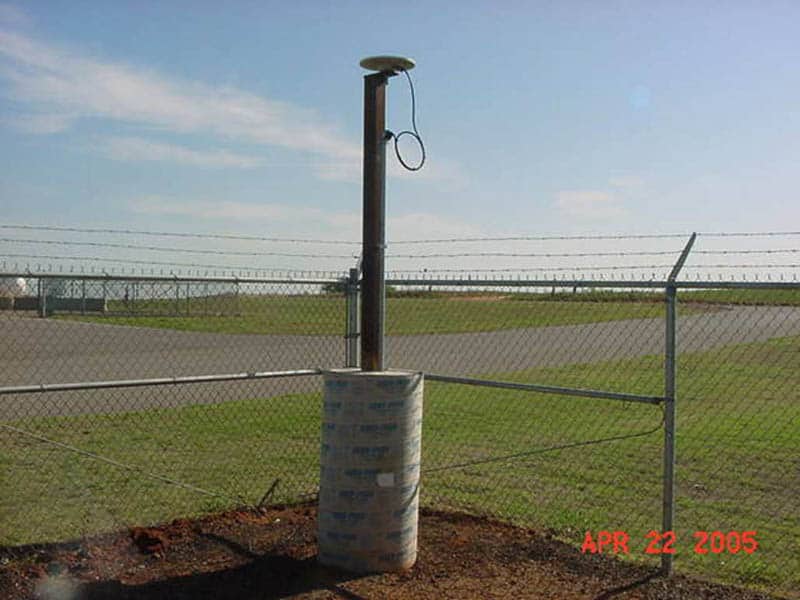
It's been at least a decade since I have used anything BUT a UNAVCO/PBO site, EXCEPT for PUC2:
We don't have a lot of options out here, and without the UNAVCO (PBO & otherwise), we would be screwed.
Loyal
What's the function of the two unadorned poles in the foreground? Lightning protection of some sort?
Jim Frame, post: 427247, member: 10 wrote: What's the function of the two unadorned poles in the foreground? Lightning protection of some sort?
Presumably, they are for the employees of surveyors to tie flagging to. There are two most likely just to challenge field parties to decide which to flag up.
Jim Frame, post: 427247, member: 10 wrote: What's the function of the two unadorned poles in the foreground? Lightning protection of some sort?
Yes!
Mark Silver can tell you everything you want to know about PUC2.
It's a great site, VERY stable and well behaved.
Loyal
Kent McMillan, post: 427242, member: 3 wrote: Actually, if you look at the photos of the Okie CORS sites, you don't need Arthur Stiles to tell you that other options might work better. Here, for example are photos of the Okie CORS antennas nearest to my project in North Texas:
OKAL
OKLW
OKDN
Note that they didn't even submit a photo of the actual antenna mounting for OKDN (presumably because it looks so iffy), but it appears that it is just a piece of conduit bolted to a metal shed.
On the other hand here is what WMOK (the CORS site that I did use) looks like, a typical UNAVCO mounting in a rock outcrop:
We have hundreds of those PBO stations in California.
Dave Karoly, post: 427251, member: 94 wrote: We have hundreds of those PBO stations in California.
They are too far from Texas to be really useful.
Dave Karoly, post: 427251, member: 94 wrote: We have hundreds of those PBO stations in California.
And some of them are RTN stations, too.
In the interest of fairness, however (which I'm sure we all want), I'm obliged to point out that the Texas CORS antennas were not any marvel of stability or excellent siting (although none are as bad as OKAL, OKLW, or OKDN pictured above). One OPUS solution used TXCH, TXQU, and TXWF and here are the photos of the same:
TXCH
While I don't particularly think that locating CORS antennas next to chain link fences is a smart idea, at least the square tube column attached to the concrete pier is short enough that stability ought not to be that much of an issue.
TXQU
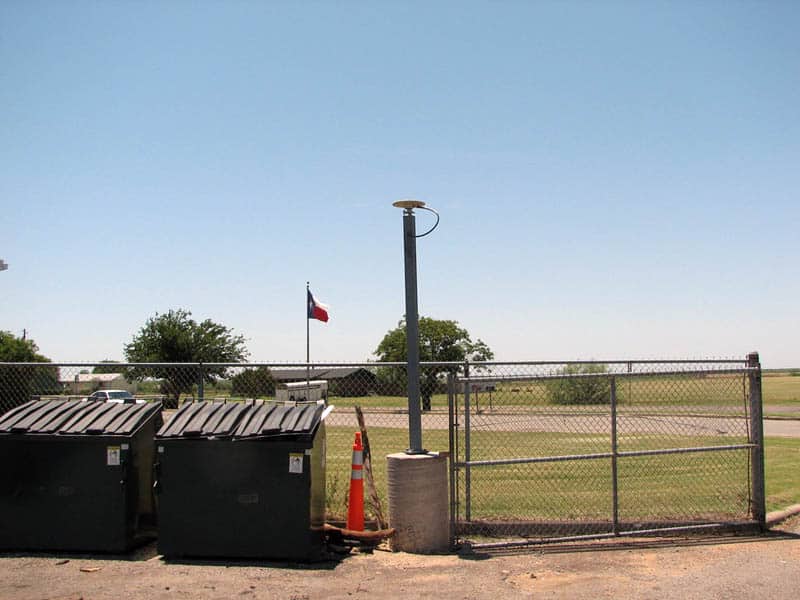
(You've to admire the placement of the antenna mount right beside the dumpsters as an example of engineering economy and one also has to wonder whether the tube column bolted to the concrete pier was originally plumb when first installed.)
TXWF
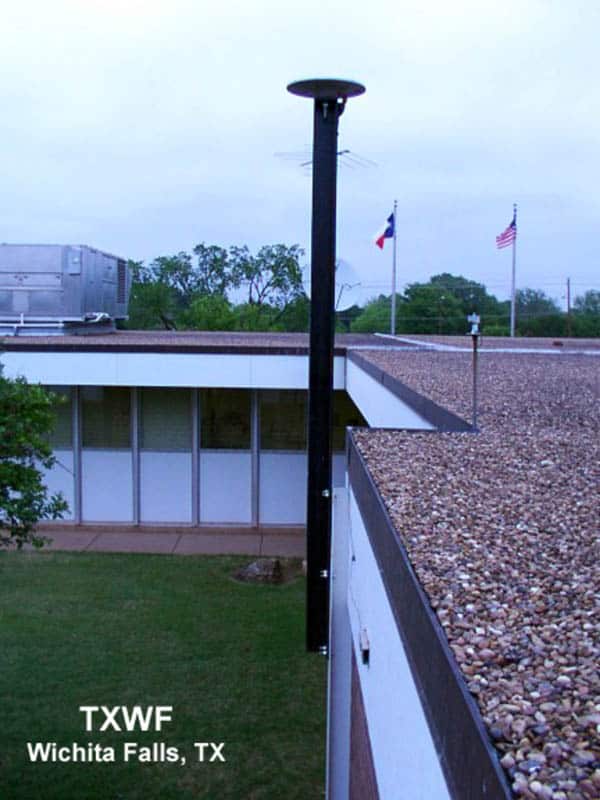
It appears from the photo that the antenna support is attached to a structural steel member of the building under it, which isn't ideal, but at least the unsupported length of the square tube to which the antenna is mounted is somewhat minimal.
Loyal, post: 427250, member: 228 wrote: everything you want to know about PUC2. It's a great site, VERY stable and well behaved.
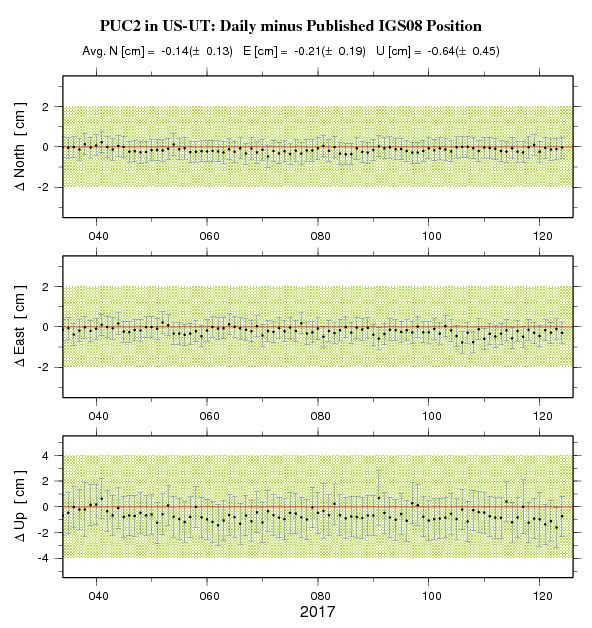
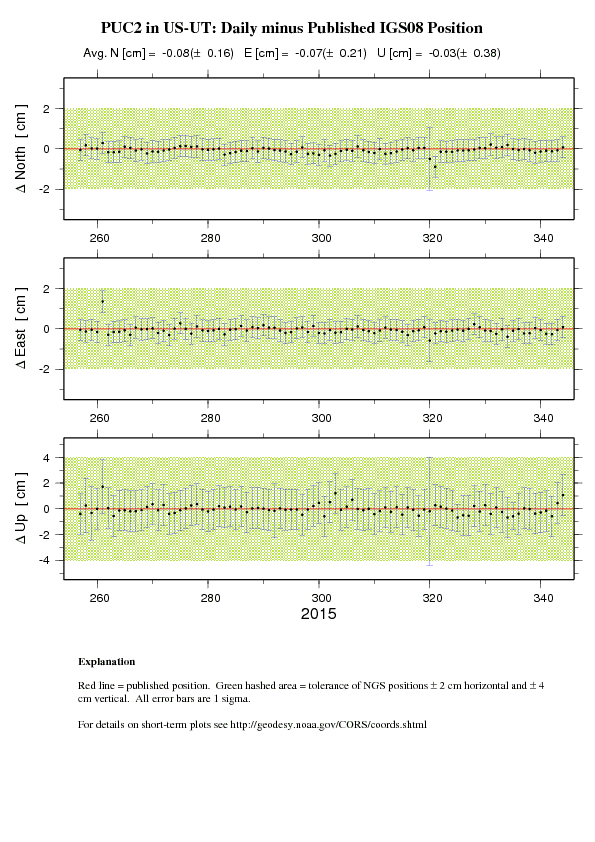
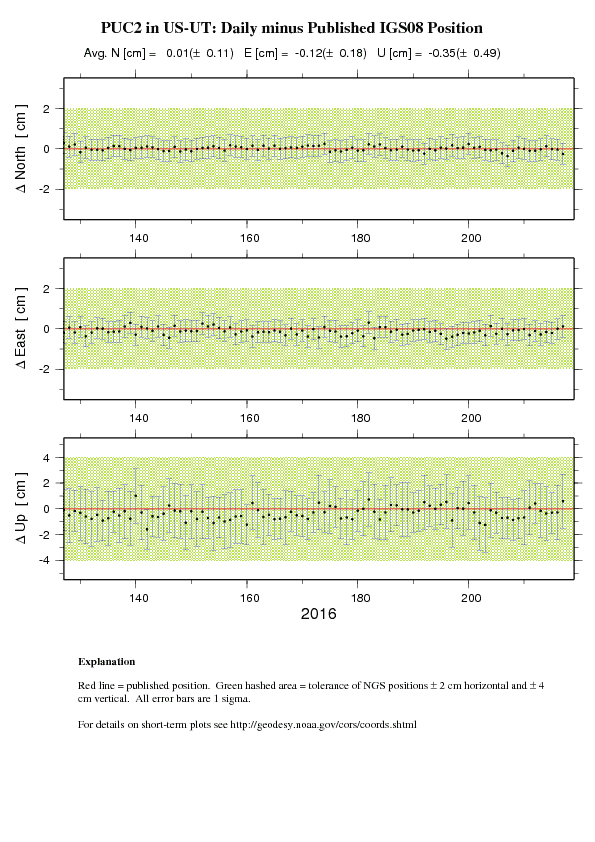
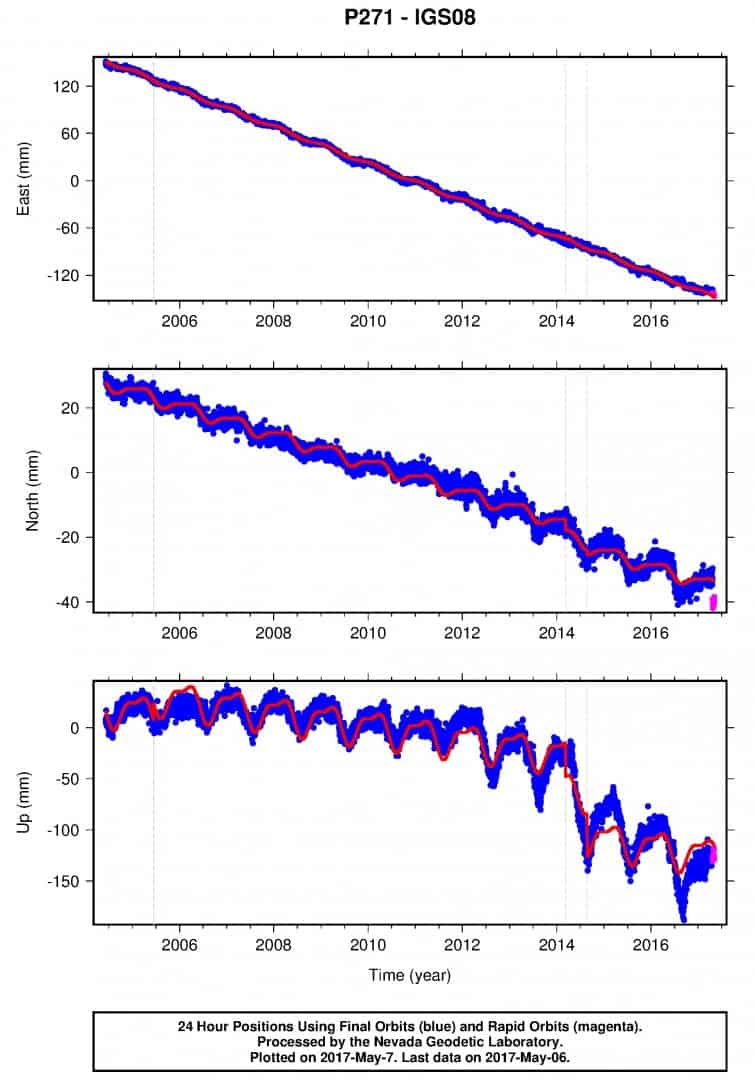
I couldn't find a long-term plot for it. The short-term plot doesn't tell enough of the story to be reliable, though it looks like PUC2 has about half the vertical movement as the most stable stations in my area.
Jim,
PUC2 was installed in December 2014 so that is why it doesn't have a long-term series plot. I used to use PUC1 until it was decommissioned in March 2016. Now I use PUC2. North and east are pretty stable, but up has moved a little over time.
Here's the first short-term plot for it beginning on 9/14/15.
The horizontal movement is pretty standard velocity for this area, but the vertical is heavily influenced by groundwater pumping, some local and some regional. I usually include it when working in the area, but I never constrain it, I just like to watch it move.
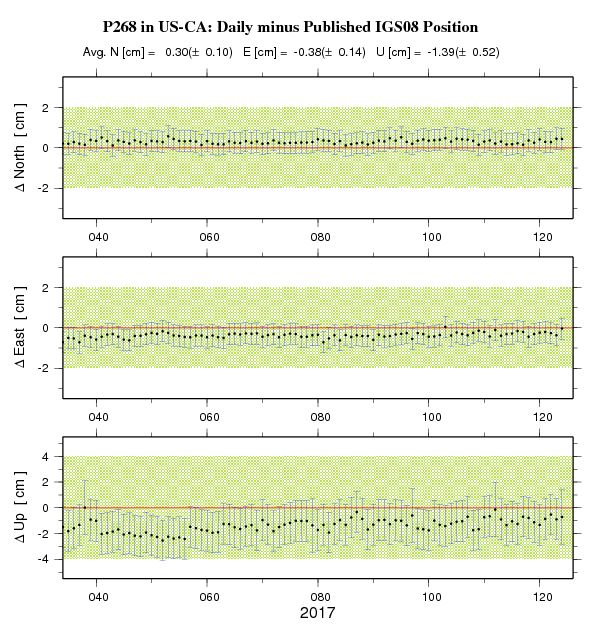
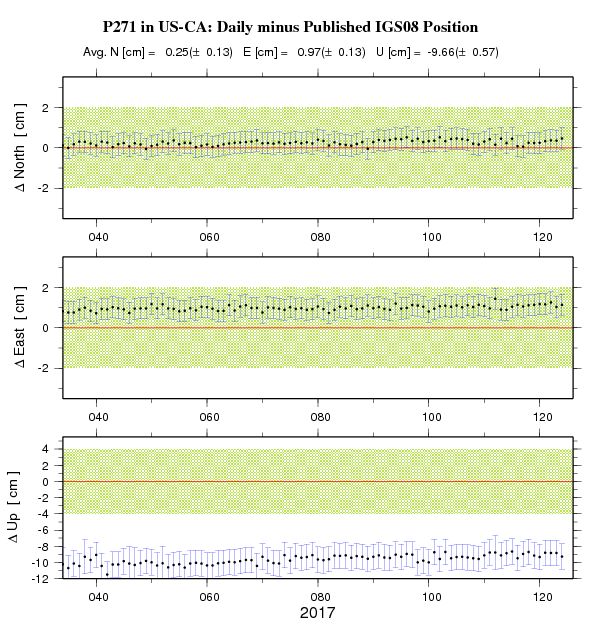
One (or is it two) thing(s) that folks NEED to understand about the NGS Short Term Times Series Plots.
1. The "published position" (Red Line) is in fact the result of applying the "published" (modeled or computed) igs08 Velocity to the "published" igs08 Position (epoch 2005.0000), for any given epoch.
2. The Red Line is de-trended (plotted as a horizontal line).
So basically these plots tell you WHERE a given site is relative to where it is predicted to be (based on the daily solutions v. the predicted position). Annual and semi-annual terms (seen in the Long Term Plots, which us the Weekly solutions), are not factored into the Short Term plots, so most sites will show "trends" (north/South, East/West, Up/Down) depending on the time of year you are looking at.
Now obviously things like local subsidence, Earthquakes, and other UN-modeled conditions can (and DO) screw things up.
Loyal
Loyal, post: 427272, member: 228 wrote: One (or is it two) thing(s) that folks NEED to understand about the NGS Short Term Times Series Plots.
1. The "published position" (Red Line) is in fact the result of applying the "published" (modeled or computed) igs08 Velocity to the "published" igs08 Position (epoch 2005.0000), for any given epoch.
Not trying to be a contrarian, but the important thing to understand about the Daily - Published IGS08 values plotted on the short-term time series plots is that the epoch is the same for the two. It doesn't matter if you use the velocity to go forward in time to bring the published IGS08 coordinates from epoch 2005.0 to the observation day or if you go back in time and compute the daily position at epoch 2005.0. I never really thought about this, but I assumed that the convention was to report the daily value at epoch 2005.0.
In the end it doesn't matter. Both obviously give the same plot. For me, the more important consideration is to know how the velocities of the selected CORS stations were determined. For example, AMC2 uses velocities published by the IGS in Nov 2010. Some CORS stations have IGS08 velocities computed in Aug 2011 using data through gpswk 1631. Other CORS stations have IGS08 velocities predicted with HTDP_3.1.2 Dec 2011. PUC2 has IGS08 velocities predicted with HTDP_3.2.3 Sep 2015 when the first short-term series was published.
It is also important to note that some CORS stations have non-zero IGS08 velocities only for x and y (PUC2 for example). If you look at the NAD83 velocities for those CORS stations there is a non-zero velocity for z that is a mathematical artifact of transforming from IGS08 to NAD83! The method used to determine a CORS station velocity is published in the coords.txt file. The file is accessed by clicking on the "Coordinates" link and then the "Position and Velocity" link.
Sorry for getting into the weeds, but looking carefully at the method employed and whether the IGS08 vz is zero are additional considerations for selecting appropriate CORS stations, in addition to the short-term plots.
