[Trigger Alert : This post mentions a particular brand of Least Squares Adjustment software and discusses a feature of it that allows the pre-analysis of survey traverses and networks to test expected results]
In case any Star*Net users are interested, here's that traverse that I posted about the other day, pointing out how conventional measurements betwen GPS-derived points tend to improve the results if the GPS vectors and conventional measurements are combined in a single least squares adjustment.
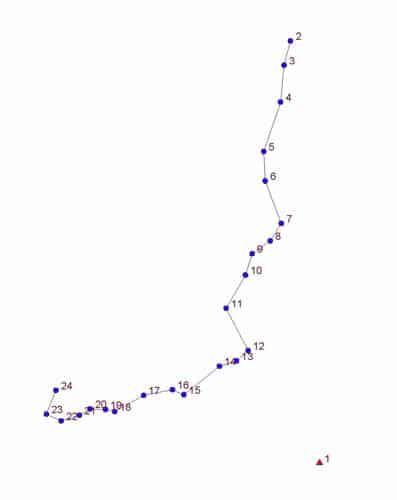
Pt. 1 is the control point with an NAD83 position that was derived from about 8 hrs of observations and connected to the Central Texas segment of the CORS network via OPUS.
GPS vectors were surveyed from Pt. 1 to various other control points and boundary markers across the project. The question here is how to locate the series of control points 2 - 24 to get the smallest uncertainties with respect to Pt. 1 (and NAD83) as well as with respect to each other for the least effort.
If you have Star*Net with the Pre-analysis feature, you can try different scenarios to find the sweet spot that promises the most bang for the buck (or the least bunk for the bag).
I've attached a copy of the input file to be copied to a Star*Net project with a .DAT suffix.
It has three data types:
"C" - Approximate coordinates of the control points to be surveyed (actually, these are State Plane coordinates- N,E format - that I just truncated to get a realistic picture of the configuration of the survey, but coordinates scaled from an aerial orthophoto or taken with a handheld during recon should work perfectly well)
The numbers that follow the Northing and Easting values of Pts. 2 and 3, i.e. 0.026 and 0.026 are estimates of the standard errors of the coordinate values that simulate a coordinate derived by a GPS vector from Pt. 1. Those values correspond with a standard error of 8mm which the better GNSS RTK systems claim. The standard errors will depend upon the equipment and methods used as well as site-specific considerations.
"A" - These are simply a listing of the angles to be measured in From-At-To format.
"D" - A listing of the distances to be measured, just the normal forward and back distances along the traverse.
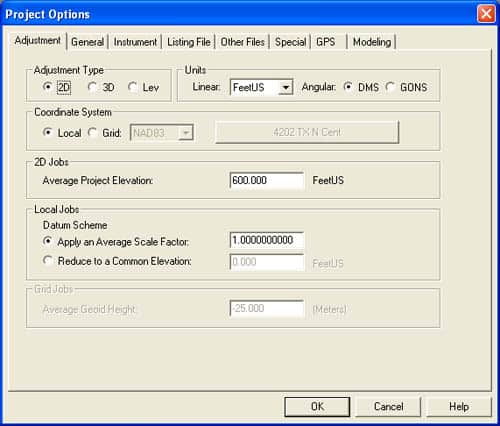
To run the Pre-analysis on this data, you need to set the Project Options. Here are the three tabs (in Star*Net Pro V.6) that you'll need to fill in.
The settings on the "Instrument" tab will be entirely determined by the equipment and methods you intend to use. These values are what I consider easy to meet with ordinary methods.
I'll follow with some examples of results.
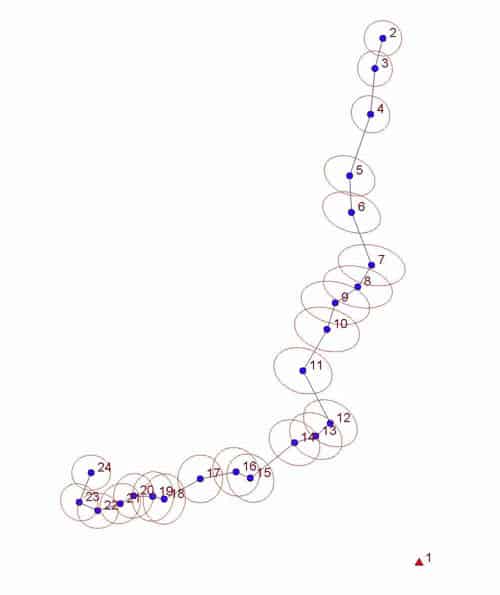
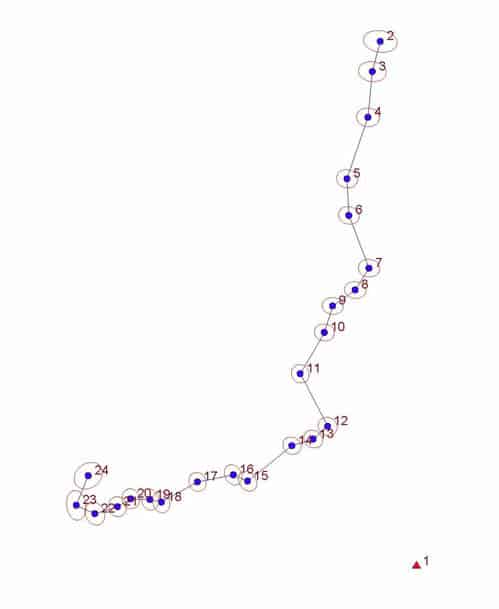
One approach would be to survey Pts. 2 and 3 and Pts. 23 and 24 at the beginning and end of the traverse, respectively, to get an approximate starting azimuth and an ending azimuth The input data I posted models the effect of positioning those four points at 8mm RTK uncertainty, i.e. with standard errors of 0.026 ft. in the N and E components of the coordinates derived for each of the four control points.
The results look like this (with the predicted uncertainties of the points indicated by 95%-confidence error ellipses plotted at exagerated scale).
Those same error ellipses are estimated to have these dimensions, increasing to a maximum around Pt. 9
[PRE]
Station Coordinate Error Ellipses (FeetUS)
Confidence Region = 95%
Station Semi-Major Semi-Minor Azimuth of
Axis Axis Major Axis
2 0.047 0.044 100-26
3 0.045 0.043 153-11
4 0.050 0.044 125-30
5 0.067 0.046 114-58
6 0.076 0.047 110-15
7 0.085 0.050 102-03
8 0.088 0.050 103-09
9 0.088 0.052 103-44
10 0.084 0.053 106-02
11 0.075 0.055 110-40
12 0.072 0.053 122-12
13 0.070 0.053 122-39
14 0.067 0.054 120-51
15 0.064 0.055 140-43
16 0.063 0.056 146-38
17 0.060 0.056 0-50
18 0.063 0.053 5-12
19 0.062 0.051 6-59
20 0.056 0.050 15-20
21 0.053 0.048 42-41
22 0.051 0.044 91-54
23 0.049 0.043 133-32
24 0.048 0.044 91-17
[/PRE]
The uncertainties in the Point-to-Point connections along the traverse are predicted to be these. The Point-to-Point distances are merely those calculated from the approximate coordinates entered for planning purposes. Obviously, until the actual distances between control points is measured in the field, these are only guesstimates for calculating the uncertainties that depend upon the distances between the points.
[PRE]
Adjusted Bearings (DMS) and Horizontal Distances (FeetUS)
=========================================================
(Relative Confidence of Bearing is in Seconds)
From To Bearing Distance 95% RelConfidence
Brg Dist PPM
2 3 S14-45-07W 157.853 25 0.012 76
3 4 S05-27-44W 232.004 21 0.012 53
4 5 S18-47-46W 328.101 19 0.012 38
5 6 S02-53-39E 185.386 18 0.012 66
6 7 S20-49-27E 284.992 17 0.012 44
7 8 S32-15-16W 129.959 18 0.012 93
8 9 S54-31-59W 139.771 19 0.012 86
10 9 N17-19-52E 140.558 20 0.012 86
10 11 S30-17-20W 241.582 20 0.012 51
11 12 S27-32-52E 299.573 21 0.012 42
12 13 S48-42-48W 97.470 23 0.012 123
13 14 S72-45-49W 112.590 24 0.012 107
14 15 S51-19-07W 286.209 24 0.012 44
15 16 N66-35-07W 79.062 24 0.012 151
16 17 S78-51-35W 183.949 24 0.012 66
17 18 S60-46-57W 208.952 24 0.012 59
18 19 N77-16-06W 59.115 29 0.011 201
19 20 N87-52-54W 97.100 34 0.012 123
20 21 S59-18-10W 77.614 38 0.012 154
21 22 S72-45-59W 119.656 41 0.012 101
22 23 N65-40-04W 102.889 45 0.012 117
23 24 N21-59-06E 160.912 47 0.017 105
[/PRE]
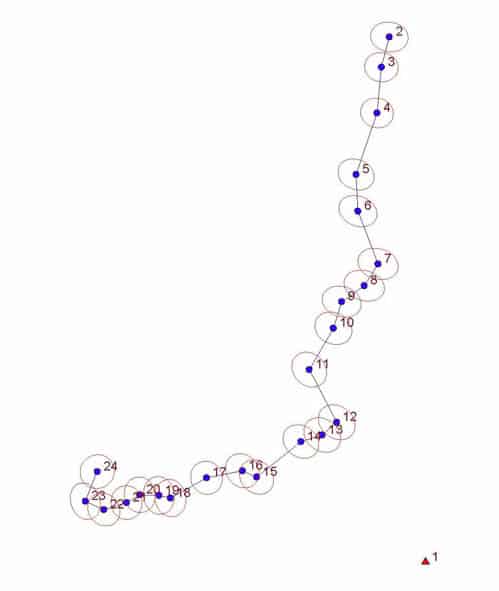
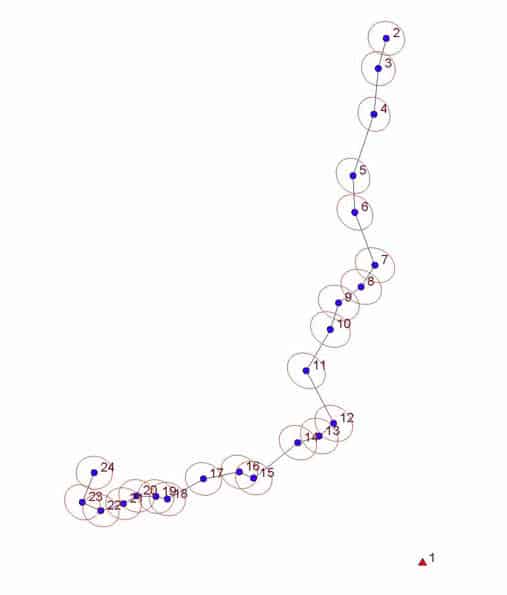
So, one obvious improvement would be to add GNSS vectors of the same 8mm quality (standard error of 0.026 ft. in N and E components of coordinates derived from vectors alone). The plot below show the irmprovements from adding just two more vectors, those from Pt. 1 to Pts. 9 and 17.
As you can see, just those two do reduce the size of the error ellipses of points along the traverse significantly. And that is from just adding two more GNSS vectors to the adjustment. All of the conventional traverse measurements remain of the same quality.
And here are the quantitative estimates of the improvements in the uncertainties of the coordinates of all 23 control points that just adding two GNSS vectors makes in this survey design. Note that these uncertainties are with respect to Pt. 1, the control point with the most accurately determined NAD83 position on the entire project. If one wanted to examine the uncertainties of the coordinates with respect to the Central Texas segment CORS network, which is as a practical matter the best realization of NAD 83 available, you'd need to increase the standard deviations in the following list by adding (root sum of squares sense) the standard errors of Pt. 1 with respect to NAD83.
Considering that Pt. 1 has uncertainties of +/- 0.011 ft. in N and +/- 0.007 ft. in E, that would mean, for example that the uncertainty (standard error) of Station 2 would be
SQRT [ 0.015^2 + 0.011^2 ] = 0.019 ft. in N and
SQRT [ 0.019^2 + 0.007^2 ] = 0.020 ft. in E,
neither of which is a huge increase, but are significant if you want to estimate uncertain with respec to NAD83 as realized by the CORS network.
[PRE]
Error Propagation
=================
Station Coordinate Standard Deviations
(FeetUS)
Station N E
2 0.015 0.019
3 0.015 0.017
4 0.015 0.016
5 0.015 0.018
6 0.016 0.019
7 0.016 0.020
8 0.015 0.020
9 0.016 0.020
10 0.016 0.019
11 0.017 0.017
12 0.017 0.018
13 0.017 0.018
14 0.017 0.018
15 0.017 0.017
16 0.017 0.017
17 0.017 0.016
18 0.019 0.016
19 0.019 0.015
20 0.018 0.015
21 0.017 0.015
22 0.016 0.016
23 0.018 0.015
24 0.017 0.017
[/PRE]
And what do the point-to-point uncertainties look like after adding two vectors:
[PRE]
Adjusted Bearings (DMS) and Horizontal Distances (FeetUS)
=========================================================
(Relative Confidence of Bearing is in Seconds)
From To Bearing Distance 95% RelConfidence
Brg Dist PPM
2 3 S14-45-07W 157.853 21 0.012 76
3 4 S05-27-44W 232.004 16 0.012 52
4 5 S18-47-46W 328.101 14 0.012 38
5 6 S02-53-39E 185.386 14 0.012 65
6 7 S20-49-27E 284.992 14 0.012 43
7 8 S32-15-16W 129.959 16 0.012 92
8 9 S54-31-59W 139.771 18 0.012 86
10 9 N17-19-52E 140.558 18 0.012 85
10 11 S30-17-20W 241.582 17 0.012 51
11 12 S27-32-52E 299.573 17 0.012 42
12 13 S48-42-48W 97.470 20 0.011 122
13 14 S72-45-49W 112.590 21 0.012 106
14 15 S51-19-07W 286.209 20 0.012 43
15 16 N66-35-07W 79.062 22 0.012 151
16 17 S78-51-35W 183.949 22 0.012 66
17 18 S60-46-57W 208.952 23 0.012 58
18 19 N77-16-06W 59.115 28 0.011 199
19 20 N87-52-54W 97.100 31 0.011 122
20 21 S59-18-10W 77.614 33 0.011 152
21 22 S72-45-59W 119.656 36 0.012 100
22 23 N65-40-04W 102.889 39 0.011 116
23 24 N21-59-06E 160.912 43 0.017 105
[/PRE]
So, if just two more vectors in parts of the traverse where the uncertainties are larger makes such an improvement, what would adding GNSS vectors of the same quality ( +/-0.026 ft. in N and E, standard error) to all of the control points do, while continuing to connect them by the same conventional traverse measurements?
Actually, it makes quite an improvement. Note that now in the positionally weakest part of the traverse, the middle section, the uncertainties are the smallest. Note that now the standard errors of all of the points positioned are significantly less than half of what just the 8mm (0.026 ft.) GNSS vectors would do.
[PRE]
Error Propagation
=================
Station Coordinate Standard Deviations
(FeetUS)
Station N E
2 0.011 0.017
3 0.010 0.014
4 0.009 0.011
5 0.009 0.010
6 0.009 0.010
7 0.009 0.010
8 0.008 0.011
9 0.008 0.010
10 0.008 0.010
11 0.009 0.009
12 0.009 0.009
13 0.009 0.009
14 0.008 0.009
15 0.010 0.009
16 0.010 0.009
17 0.009 0.008
18 0.011 0.008
19 0.010 0.008
20 0.010 0.008
21 0.010 0.009
22 0.011 0.010
23 0.015 0.010
24 0.013 0.014
[/PRE]
Okay, so GNSS vectors with an uncertainty of +/-8mm (= 0.026 ft. in N and E) to all control points on the traverse that are then connected by conventional traverse angle and distance measurements gives uncertainties in the range of:
0.008 - 0.015 ft. in N and
0.008 - 0.017 ft. in E.
So, what would a scheme with GNSS vectors of the same uncertainties from Pt. 1 look like but with 1/3 fewer vectors? Suppose we don't survey the vectors to Pts. 5, 6, 10, 11, 15, 16, 20, and 21, for example?
Well, as it turns out, the increase in uncertainty isn't that much:
[PRE]
Error Propagation
=================
Station Coordinate Standard Deviations
(FeetUS)
Station N E
2 0.012 0.019
3 0.011 0.016
4 0.011 0.014
5 0.011 0.013
6 0.010 0.013
7 0.010 0.013
8 0.010 0.013
9 0.010 0.013
10 0.010 0.012
11 0.011 0.010
12 0.011 0.010
13 0.011 0.011
14 0.011 0.010
15 0.013 0.011
16 0.013 0.010
17 0.011 0.010
18 0.013 0.010
19 0.013 0.010
20 0.012 0.010
21 0.012 0.010
22 0.013 0.011
23 0.016 0.011
24 0.014 0.015
[/PRE]
On one occasion I used the pre-analysis to show how many times monitoring points would have to be repetitiously observed to be able to achieve results accurate to .01' vs 0.02'.
Hello Kent, you deserve kudos for taking the time to post that here. It can only be a good thing if a few more people start doing combined GNSS & TPS adjustments.
Just out of interest, could you re-run the numbers for me with different accuracy inputs?
In the case where you had GNSS vectors to 2, 3, 23 and 24, could you change the instrument accuracies to reflect an instrument capable of 1" angle accuracy (0.7" directional uncertainty) and 0.5mm+1.5ppm EDM quality. What's the positional uncertainties for stn 9 now? Is it better in this case to use a really good total station under good observing conditions, or to add a few more GNSS vectors?
Cheers.
Conrad, post: 432274, member: 6642 wrote: Hello Kent, you deserve kudos for taking the time to post that here. It can only be a good thing if a few more people start doing combined GNSS & TPS adjustments.
Just out of interest, could you re-run the numbers for me with different accuracy inputs?
In the case where you had GNSS vectors to 2, 3, 23 and 24, could you change the instrument accuracies to reflect an instrument capable of 1" angle accuracy (0.7" directional uncertainty) and 0.5mm+1.5ppm EDM quality. What's the positional uncertainties for stn 9 now? Is it better in this case to use a really good total station under good observing conditions, or to add a few more GNSS vectors?
Cheers.
That's a good question. Shall we assume an instrument and target centering uncertainty of 0.001 ft. (= 0.3mm) ?
Here are the predicted uncertainties of the control points connected by the traverse if the following instrument uncertainties that Conrad asked about are tested :
1" = Uncertainty of Angles (s.e.)
0.001 ft. = Instrument centering error (s.e.)
0.001 ft. = Target and Prism centering error (s.e.)
0.0016 ft. (0.5mm) = EDM constant (s.e)
1.5 ppm = EDM scale uncertainty
[PRE]
Error Propagation
=================
Station Coordinate Standard Deviations
(FeetUS)
Station N E
2 0.017 0.019
3 0.018 0.017
4 0.018 0.016
5 0.018 0.017
6 0.018 0.018
7 0.018 0.020
8 0.018 0.021
9 0.018 0.021
10 0.018 0.020
11 0.018 0.010
12 0.018 0.019
13 0.018 0.019
14 0.018 0.019
15 0.017 0.019
16 0.017 0.019
17 0.017 0.019
18 0.017 0.018
19 0.017 0.018
20 0.017 0.018
21 0.016 0.018
22 0.017 0.019
23 0.018 0.018
24 0.017 0.019
[/PRE]
[PRE]
Adjusted Bearings (DMS) and Horizontal Distances (FeetUS)
=========================================================
(Relative Confidence of Bearing is in Seconds)
From To Bearing Distance 95% RelConfidence
Brg Dist PPM
2 3 S14-45-07W 157.853 14 0.004 25
3 4 S05-27-44W 232.004 12 0.004 17
4 5 S18-47-46W 328.101 11 0.004 13
5 6 S02-53-39E 185.386 11 0.004 21
6 7 S20-49-27E 284.992 10 0.004 15
7 8 S32-15-16W 129.959 10 0.004 30
8 9 S54-31-59W 139.771 10 0.004 28
10 9 N17-19-52E 140.558 11 0.004 28
10 11 S30-17-20W 241.582 11 0.004 17
11 12 S27-32-52E 299.573 11 0.004 14
12 13 S48-42-48W 97.470 12 0.003 39
13 14 S72-45-49W 112.590 12 0.003 34
14 15 S51-19-07W 286.209 13 0.004 14
15 16 N66-35-07W 79.062 14 0.004 48
16 17 S78-51-35W 183.949 14 0.004 22
17 18 S60-46-57W 208.952 14 0.004 19
18 19 N77-16-06W 59.115 17 0.004 64
19 20 N87-52-54W 97.100 20 0.004 40
20 21 S59-18-10W 77.614 23 0.004 49
21 22 S72-45-59W 119.656 25 0.004 32
22 23 N65-40-04W 102.889 26 0.004 37
23 24 N21-59-06E 160.912 28 0.006 35
[/PRE]
So, using an instrument with the very low uncertainties that Conrad suggested should give the following uncertainties of points along the traverse if only 2, 3, 23, and 24 are positioned via GNSS vectors from Pt. 1.
[PRE]
Error Propagation
=================
Station Coordinate Standard Deviations
(FeetUS)
Station N E
2 0.017 0.019
3 0.018 0.017
4 0.018 0.016
5 0.018 0.017
6 0.018 0.018
7 0.018 0.020
8 0.018 0.021
9 0.018 0.021
10 0.018 0.020 [0.010 in the post above was a typo]
11 0.018 0.020
12 0.018 0.019
13 0.018 0.019
14 0.018 0.019
15 0.017 0.019
16 0.017 0.019
17 0.017 0.019
18 0.017 0.018
19 0.017 0.018
20 0.017 0.018
21 0.016 0.018
22 0.017 0.019
23 0.018 0.018
24 0.017 0.019
[/PRE]
But what happens if you add just two more GNSS vectors to locate Pts. 9 and 17? As it turns out, you the model predicts a significant improvement:
[PRE]
Error Propagation
=================
Station Coordinate Standard Deviations
(FeetUS)
Station N E
2 0.014 0.018
3 0.014 0.017
4 0.014 0.015
5 0.014 0.014
6 0.014 0.016
7 0.014 0.015
8 0.014 0.015
9 0.014 0.015
10 0.014 0.015
11 0.014 0.014
12 0.014 0.014
13 0.014 0.014
14 0.014 0.014
15 0.013 0.014
16 0.013 0.014
17 0.013 0.014
18 0.014 0.014
19 0.014 0.014
20 0.014 0.014
21 0.014 0.014
22 0.016 0.014
23 0.017 0.014
24 0.016 0.015
[/PRE]
What I see is that going to a 1" gun doesn't do much for the precision of the final coordinates.
Mark Mayer, post: 432293, member: 424 wrote: What I see is that going to a 1" gun doesn't do much for the precision of the final coordinates.
I think that the conclusion to be drawn is that in this situation where a short series of control points can be surveyed conventionally with a much smaller uncertainty than positioning by GNSS vectors alone will yield, the uncertainties drop as more GNSS vectors are added along the traverse, but that there is a point of diminishing returns as the number of vectors increases. In this example, the number of GNSS vectors is more critical than the quality of the instrument used to measure the traverse connecting the points.
If a person wanted to formalize this, they could plot the decrease in standard errors as the number of vectors increases (assuming that the vectors are chosen for maximum benefit).
If the input data was actual 1" data, instead of 3" data masquerading, the SD results might be different. But not much.
Kent McMillan, post: 432294, member: 3 wrote: the uncertainties drop as more GNSS vectors are added along the traverse, but that there is a point of diminishing returns as the number of vectors increases.
Agreed. This example would like to have a vector into maybe 10, 11, or 12 in addition to the beginning and end. Perhaps a vector into every 4-6 points along the traverse would yield improvement. Much beyond that wouldn't add much.
Mark Mayer, post: 432298, member: 424 wrote: This example would like to have a vector into maybe 10, 11, or 12 in addition to the beginning and end. Perhaps a vector into every 4-6 points along the traverse would yield improvement. Much beyond that wouldn't add much.
One thing that's worth pointing out is that a surplus of vectors also gives a way to validate the weighting scheme used in the adjustment in a way that a sparse set of vectors doesn't. My suspicion is that the optimal scheme will be one in which the conventional measurements connecting points located by GPS vectors give equal or better relative uncertainties between the same points. That would mean that vectors to pairs of adjacent control points or points separated by just a couple of intervening points would be the most efficient choice. That's just an untested hunch, though.
Thanks Kent.
So it appears to me that at station 9, the 1" instrument traverse with GNSS ties just at the ends is keeping up with your 3" example with GNSS vectors to 9 and 17 to within about 1mm uncertainty, yes?
Also the high accuracy instrument has a nice 'flatness' to the list of uncertainties when just tied at the ends that the 3" traverse doesn't have. The 3" has a bit of a flare out in the middle.
Here are what the uncertainties looks like with vectors from Pt. 1 to Pts. 6, 11, and 17 in addition to those to 2, 3, 23, and 24.
These use Conrad's instrument, i.e.
0.0016 ft. + 1.5ppm Distances
1" Angles
0.001 ft. Instrument Centering
0.001 ft. Target centering
[PRE]
Error Propagation
=================
Station Coordinate Standard Deviations
(FeetUS)
Station N E
2 0.012 0.018
3 0.012 0.016
4 0.012 0.014
5 0.013 0.013
6 0.013 0.013
7 0.012 0.014
8 0.012 0.015
9 0.012 0.014
10 0.012 0.014
11 0.013 0.013
12 0.013 0.013
13 0.012 0.013
14 0.012 0.013
15 0.012 0.014
16 0.012 0.013
17 0.012 0.013
18 0.013 0.013
19 0.014 0.013
20 0.014 0.013
21 0.014 0.014
22 0.015 0.014
23 0.017 0.014
24 0.016 0.015
[/PRE]
On the other hand, if you relax the standard errors to somewhat more pedestrian values:
0.006 ft. + 2ppm Distances
3" Angles
0.001 ft. Instrument Centering
0.003 ft. Target centering
The model predicts the following undertainties, which are a pretty close second place finish:
[PRE]
Error Propagation
=================
Station Coordinate Standard Deviations
(FeetUS)
Station N E
2 0.014 0.019
3 0.014 0.016
4 0.014 0.015
5 0.014 0.016
6 0.014 0.017
7 0.014 0.019
8 0.014 0.020
9 0.014 0.020
10 0.015 0.018
11 0.015 0.016
12 0.016 0.017
13 0.016 0.017
14 0.015 0.017
15 0.016 0.016
16 0.017 0.016
17 0.016 0.015
18 0.019 0.015
19 0.019 0.015
20 0.018 0.015
21 0.017 0.015
22 0.017 0.016
23 0.019 0.015
24 0.017 0.018
[/PRE]
Conrad, post: 432306, member: 6642 wrote: So it appears to me that at station 9, the 1" instrument traverse with GNSS ties just at the ends is keeping up with your 3" example with GNSS vectors to 9 and 17 to within about 1mm uncertainty, yes?
Also the high accuracy instrument has a nice 'flatness' to the list of uncertainties when just tied at the ends that the 3" traverse doesn't have. The 3" has a bit of a flare out in the middle.
Yes. using these standard errors:
0.006 ft. + 2ppm EDM
3" Angles
0.001 Instrument Centering
0.003 Target centering
and adding two vectors, one to Pt.9 and one to Pt.17 in addition to Pts. 2,3,23 and 24 yields:
[PRE]
Error Propagation
=================
Station Coordinate Standard Deviations
(FeetUS)
Station N E
2 0.015 0.019
3 0.015 0.017
4 0.015 0.016
5 0.015 0.018
6 0.016 0.019
7 0.016 0.020
8 0.015 0.020
9 0.016 0.020
10 0.016 0.019
11 0.017 0.017
12 0.017 0.018
13 0.017 0.018
14 0.017 0.018
15 0.017 0.017
16 0.017 0.017
17 0.017 0.016
18 0.019 0.016
19 0.019 0.015
20 0.018 0.015
21 0.017 0.015
22 0.016 0.016
23 0.018 0.015
24 0.017 0.017
[/PRE]
Whereas dropping the vectors to Pts. 9 and 17, and using a better instrument to measure the traverse, one with the following standard errors
0.0016 ft. + 1.5ppm EDM
1" Angles
0.001 Instrument Centering
0.001 Target centering
yields these uncertainties.
[PRE]
Error Propagation
=================
Station Coordinate Standard Deviations
(FeetUS)
Station N E
2 0.017 0.019
3 0.018 0.017
4 0.018 0.016
5 0.018 0.017
6 0.018 0.018
7 0.018 0.020
8 0.018 0.021
9 0.018 0.021
10 0.018 0.020
11 0.018 0.020
12 0.018 0.019
13 0.018 0.019
14 0.018 0.019
15 0.017 0.019
16 0.017 0.019
17 0.017 0.019
18 0.017 0.018
19 0.017 0.018
20 0.017 0.018
21 0.016 0.018
22 0.017 0.019
23 0.018 0.018
24 0.017 0.019
[/PRE]
I'd say that the uncertainties are as a practical matter nearly identical, although operationally it may turn out to be a better scheme to add two vectors if lesser quality conventional measurements are tolerable or better.
Awesome, Thank you Kent?ÿ
