In another thread, John Hamilton asked when the NGS should update the coordinates for CORS stations when they exceed 2 cm in the horizontal and 4 cm in the vertical. Jim Frame and SPMPLS posted a couple of example CORS stations in California, P271 and P565 that show extreme differences in the vertical between the daily and published coordinates. I was particularly struck by CORS station P565 and what possible reasons there may be (other than budgetary) for the NGS not to update the coordinates.
Over the years I have used the 60-day and 90-day short time series plots to evaluate and occasionally adjust the coordinates of CORS stations in adjustments of OPUS solutions. I would download the short term plots for the CORS stations that I used and save them. Unfortunately, I didn't always remember to download the plots and/or had other CORS stations that I wanted to use in an OPUS solution. While I wish that NGS would provide a feature that would be able to extract the plots for any given time period, that is not likely to happen. In 2010 and 2011, I saved the plots of all CORS stations for two projects. Finally in 2013, I began to save the short term plots for all CORS stations. Initially, I saved them every 1 to 2 months and now I do it every 2 to 3 months.
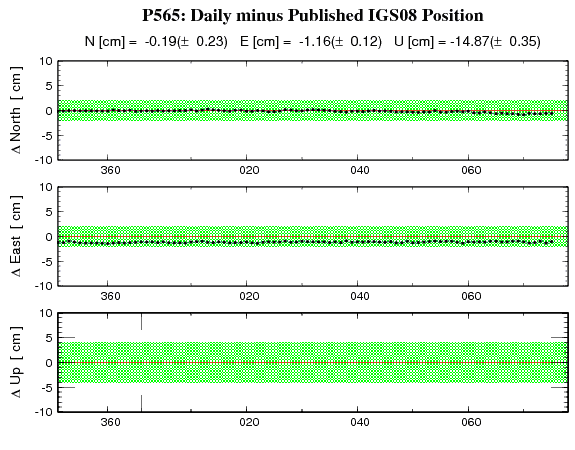
I took a look the short-term plots from 2011 to 2017 for P565 and the vertical residuals indicate large scale subsidence during the summer and early fall which is likely due to groundwater pumping. P565 is located in Delano, CA where pumping of groundwater has created substantial subsidence over the years. Here is Land Subsidence due to Ground-Water Withdrawl Tulare-Wasco Area California, U.S. Geological Survey Bulletin 437-B, 1969 that describes historical subsidence in the area of CORS station P565.
The rate of subsidence is very pronounced during the California drought years and basically flatlines in 2017. Sometimes it is more valuable that the NGS does not continually update the published coordinates when the residual reaches 4 cm. The annual fluctuations are most interesting for hydrogeologists such as myself.
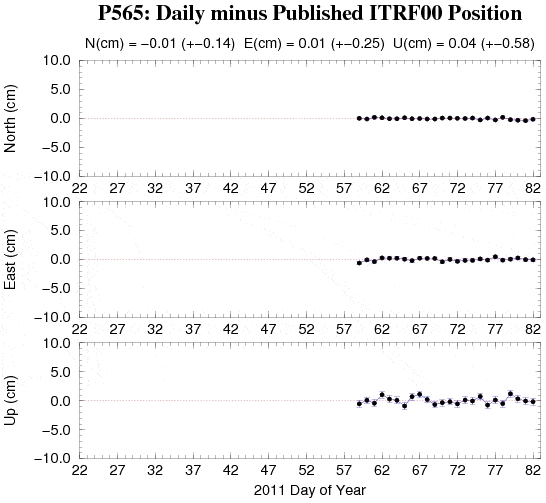
Short term plot for March 27, 2011 showing residuals near zero.
The following plots show an initial decline of 5 cm followed by a slight rebound. Dates are approx. May 10, 2013 through March 31, 2014
The next four plots show the vertical residual falling below the -10 cm limit of the standard short-term plot
This shows the next 90 days for completeness (2014 - 2015).

In 2015, the NGS changed the look of the short-term plots.
2016 plots.
2017 Plots
Information is in the eye of the beholder.
MathTeacher, post: 448956, member: 7674 wrote: Information is in the eye of the beholder.
Hmmm....all these years I thought the clich??s were, "Beauty is in the eye of the beholder." and "Facts are facts!" 😉
Let's hope no surveyor or anyone else is using it for elevation control:(
MightyMoe, post: 448978, member: 700 wrote: Let's hope no surveyor or anyone else is using it for elevation control:(
That would depend. Is the subsidence specific a small area around the CORS or does it impact the region on a county wide or larger scale? If larger, then I would prefer to use vertical control that is nearer and while transient, at least it's moving at generally the same velocity as my project.
This may eventually prove that local vectors are still better than long vectors, even though the processing capabilities afford us the ability to use control a hundred or more miles away.
Gene Kooper, post: 448966, member: 9850 wrote: Hmmm....all these years I thought the clich??s were, "Beauty is in the eye of the beholder." and "Facts are facts!" 😉
What struck me, Gene, was that John Hamilton would be better served by a rigorous update procedure, while your needs are often served when updates are not timely. And it seems that both of you could be served by timely updates supplemented with historical data.
Perhaps my paraphrase of an old saying is not too far off.
If the daily variations were reliably understood, guaranteed to be caused by surface motion and not a change in the antenna or some other non-geological cause, it could become part of time displacement model. Then long vectors could still be used, but local daily or weekly velocities could be applied.
Unfortunately OPUS still provides enough poor solutions to keep this from being feasible. A bad solution on your local CORS on Thursday could be a big problem. But perhaps a model based on 30 day averages would be suitable.
The question comes down to this. Is the displacement caused by ground displacement or something mechanical?
If it's mechanical, then an updated coordinate is in order. If it is geological then a velocity would be more appropriate. A mechanical change would be relevant to a single point, the CORS. A geological change would be relevant to a local area of indeterminate size affecting nearby points as well. Some human intelligence of the CORS would be necessary to distinguish between them. If a CORS shows out of tolerance displacement, perhaps there should be some protocol in which NGS makes contact with the CORS operator to determine the cause of the displacement and decides whether the displacement should be modeled or a new coordinate determined.
When regional subsidence from fluid withdrawal is the cause, modeling may not work out very well for predicting future movement. As Gene noted, the movement at P565 slowed dramatically when we got a big rain year and much less pumping was needed for agriculture. If we get more wet years it may come up some, though likely not as much as it dropped due to aquifer compaction.
MightyMoe, post: 448978, member: 700 wrote: Let's hope no surveyor or anyone else is using it for elevation control:(
This station does not have a long-term plot, but that may be because of the subsidence issue. The IGS08 velocities are, "Predicted with HTDP_3.1.2 Dec 2011." There is a slight jump in the horizontal residuals on October 18, 2015 (291). There were several small earthquakes around San Ramon, CA that week, but that shouldn't have affected Delano, CA.
In a pinch and depending upon the project requirements, I might consider using P535 in an OPUS Projects solution. The horizontal residuals are not horrible, with E hovering between 1.5 and 1.89 cm the last 18 months. OPUS Projects allows the user to constrain the CORS station as "Horz. only" or "3D".
The dashed pink line in the second to last plot shows that the receiver and firmware were changed on April 18, 2017 (108).
IMO this station is a problematic station for the NGS to update. The subsidence is likely tied to overpumping of the groundwater. As Jim mentioned, computing a vertical velocity would not model the seasonal nature of the subsidence, nor account for the wet conditions this year. And, without the archived short-term plots, the reason for the 30 cm vertical residuals would be unknown.
The velocities would need to be non-linear.
Shawn Billings, post: 449042, member: 6521 wrote: The velocities would need to be non-linear.
In this case, piecewise linear functions is the only way I know to model the seasonal subsidence and rainy year. I don't see that as a good way to handle this problem.
Hopefully, when IGS14 comes out, the NGS will have computed velocities for many of the CORS stations that currently have velocities predicted from HTDP. Anyone know if this will be the case?
Gene Kooper, post: 449036, member: 9850 wrote: This station does not have a long-term plot, but that may be because of the subsidence issue. The IGS08 velocities are, "Predicted with HTDP_3.1.2 Dec 2011." There is a slight jump in the horizontal residuals on October 18, 2015 (291). There were several small earthquakes around San Ramon, CA that week, but that shouldn't have affected Delano, CA.
In a pinch and depending upon the project requirements, I might consider using P535 in an OPUS Projects solution. The horizontal residuals are not horrible, with E hovering between 1.5 and 1.89 cm the last 18 months. OPUS Projects allows the user to constrain the CORS station as "Horz. only" or "3D".
The dashed pink line in the second to last plot shows that the receiver and firmware were changed on April 18, 2017 (108).
IMO this station is a problematic station for the NGS to update. The subsidence is likely tied to overpumping of the groundwater. As Jim mentioned, computing a vertical velocity would not model the seasonal nature of the subsidence, nor account for the wet conditions this year. And, without the archived short-term plots, the reason for the 30 cm vertical residuals would be unknown.
It has always been problematic to use CORS as a basis for elevations. What should be done in areas with large movements will continue to be an issue.
If the CORS is moving with the surrounding topography then it may kinda work to continue to use it. But, CORS has never returned anything near accurate elevations even in the more stable areas where I work.
I will "back-in" an ellipsoid height for a CORS station, then use that height when using CORS data.
I look at elevations from GPS a little differently Moe. I normally get decent ellipsoidal heights from OPUS and esp. OPUS Projects. My problem is with computing elevations from geoid models in mountainous terrain because of the lack of good gravity data. I helped develop a coordinated cadastre for a county in the Foothills and had very good orthometric heights for bench marks along I-70. That is because those bench marks were included in the control for the GEOID12B model (i.e. their geoid separations were good). My confidence in other control stations away from those bench marks was far less. The county GIS folks were hoping that the GEOID12B derived orthometric heights would be good enough for elevation certs.
Besides the lack of gravity data, it is informative to see that an interpolated geoid separation is computed from a 6x6 grid of separations in GEOID12B (the grid values every 1 arc-minute). As an example here are the 36 geoid grid values that were used to interpolate my main base station in an alpine valley at 11,300 ft. The lat/long of the upper left is 39?ø21'00" N, 106?ø10'00"W and the lower right is 39?ø16'00" N, 106?ø05'00"W
-12.7820, -12.7633, -12.7735, -12.7764, -12.8061, -12.8656
-12.7660, -12.7723, -12.7760, -12.7797, -12.8035, -12.8658
-12.7692, -12.7708, -12.7947, -12.8161, -12.8271, -12.8843
-12.7965, -12.8093, -12.8006, -12.8441, -12.8685, -12.9062
-12.8193, -12.8333, -12.8505, -12.8596, -12.8969, -12.9277
-12.8493, -12.8492, -12.8451, -12.8710, -12.9004, -12.9254
The minimum/maximum are -12.928 and -12.763 m.
The mean and standard deviation are -12.829 ?ñ0.042 m
The GEOID12B online calculator produces -12.824 m.
The NGS program employs a fast 1-Dimensional equidistant spline interpolation, with free boundary end conditions
Reference: Josef Stoer: EINFUHRUNG IN DIE NUMERISCHE MATHEMATIK I, Springer 1972, Page 82 and 86.
The algorithm was written in July 1983 by Rene Forsberg and modified by the NGS in May 2007.
I'm looking forward to seeing the results of the third slope validation survey in southern Colorado that crosses two mountain passes. It should give a good feel for what we should expect from a gravimetric geoid derived from GravD when it is finally completed.
Gene Kooper, post: 449045, member: 9850 wrote: In this case, piecewise linear functions is the only way I know to model the seasonal subsidence and rainy year.
I agree. I doubt that a function would exist to define the velocity. Mostly you could model segments of the past with extrapolation only being valid shortly into the future between adjustments.
I'm lucky to have a couple of level runs over the mountain, the interesting result of using the geoid model and CORS values was that the "miss" on bench marks on the mountain was very close to the "miss" down on the plain. Same direction (high)
These aren't at 11,000+ Feet but there is a good 4000-5000' elevation change.
However they did it, they modeled the geoid shape rather well.
In some directions at some locations geoid heights are changing over .5'/mile so it can't be a simple thing to do accurately.
MightyMoe, post: 449047, member: 700 wrote: It has always been problematic to use CORS as a basis for elevations.
That is essentially what will happen in 2022 or thereabouts with the addition of a new geoid model. GNSS will be the basis of the new vertical datum and I would assume primarily using OPUS or at least the CORS.
SHG
Shelby H. Griggs PLS, post: 449079, member: 335 wrote: That is essentially what will happen in 2022 or thereabouts with the addition of a new geoid model. GNSS will be the basis of the new vertical datum and I would assume primarily using OPUS or at least the CORS.
SHG
It won't happen overnight, if it's anything like the last change 2045 might get it all done.
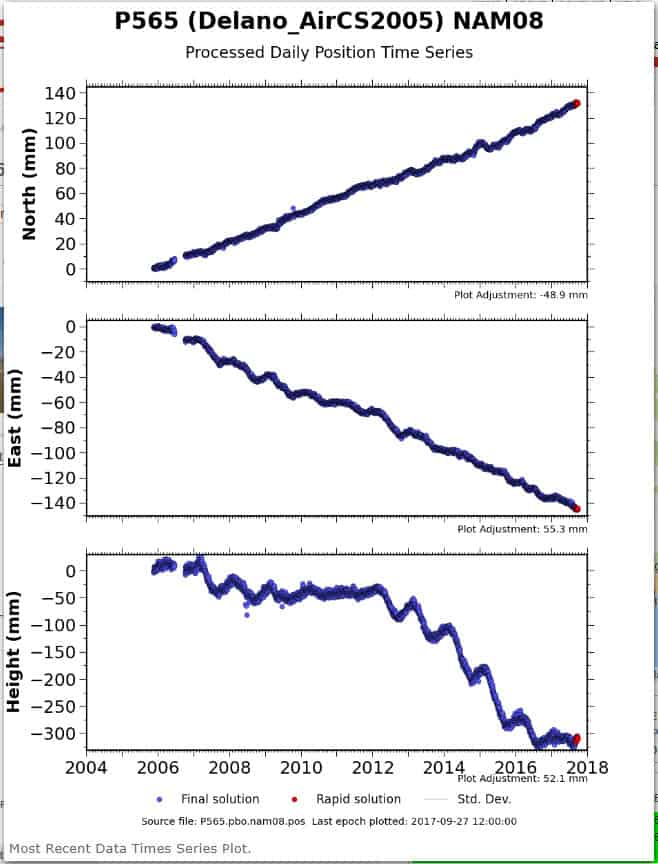
Here is the PBO times series for P565. The seasonal roller coaster would be hard enough to model, but the wildly changing vertical velocity (non-linear) would be almost impossible and would serve no purpose for looking into the future based on the past.
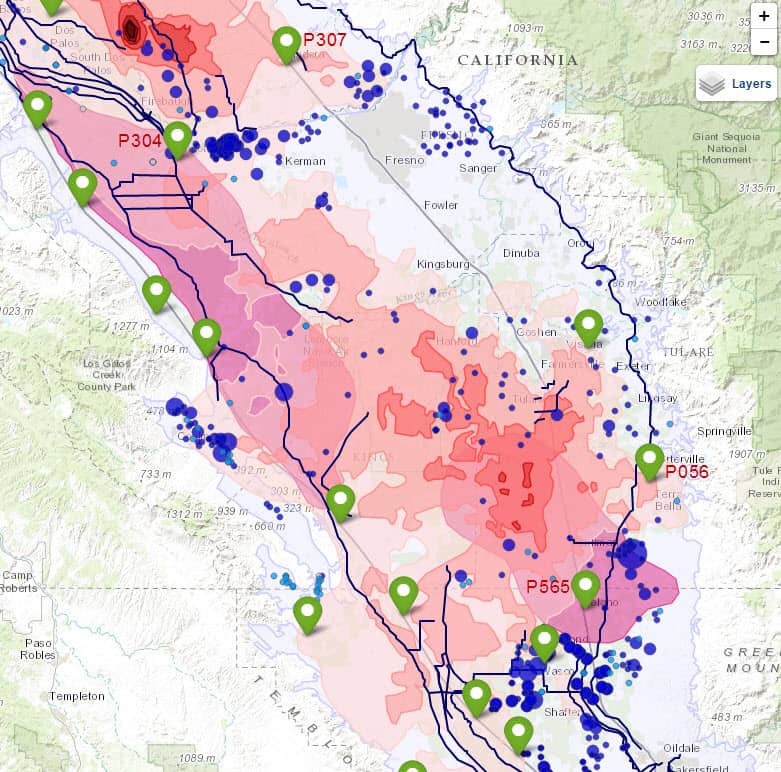
Here is a screen capture from the USGS San Joaquin Valley Drought Indicators site. As you can see, the subsidence has been severe and quite localized in some areas, so applying the logic that it is all sinking together isn't valid even over distances as short as a mile in some areas (El Nido Bowl in upper left).
Eppur si muove!
The NGS CORS long-term plots have not updated since 2012, they should refresh by early 2018 when NGS finishes reprocessing of all CORS data using IGS14 reference frame. This should also provide improved coordinates, velocities, and discontinuities (earthquakes and equipment changes). That reprocessing is reasonably automated (given the millions of files involved) until you get out west, where sites careen around like drunken sailors.
The NGS CORS short-term plots are generated from a special "net" version of OPUS which holds only the IGS frame as fixed. Normal OPUS obeys the National Spatial Reference Frame contention that all official coordinates are golden, though it does add HTDP to move things back and forth through time using the (from 2012-era) computed and modeled velocities. Many CORS were new back then and the velocities are relatively immature.
OPUS-S is now trained to solve from 5 nearby CORS and ignore the worst two solutions, so if only one CORS walks off from the official published position, OPUS should ignore it. For belt-and-suspenders, it also has an occasionally-updated blacklist of CORS to ignore, which includes these errant sites, mostly in California and Alaska.
The next reference frame won't be as beholden to these local motions, by design it takes off of ITRF with a simple clockwork-style Euler pole correction to remove all of the steady continental drift, and provides results at survey epoch (vs NSRS epoch 2010.0) Users can move points through time using an intra-frame velocity model (ala HTDP) to try to account for all of the localized variations, and the huge regional deformation out west where the Pacific plate drags California northward. This frame should be more honest and easier for to maintain, though it means that some local users will have to get used to their "control" drifting slightly over time. Eppur si muove indeed!


